
Knowing how many leads convert to opportunities is just the start of your lead conversion metrics journey.
Deep diving into more detailed metrics will help you optimise revenue from converted leads, figure out what’s working and what’s not, and work out when marketing and sales are wasting valuable time on non-productive leads. Also, they’re easy to implement. Let me talk you through them:
The definition
Lead conversion happens when someone ‘converts’ an existing lead into an Account, Contact and Opportunity. The Opportunity is then passed on to the sales team to begin the sales process.
Metric 1: Contribution of Converted Leads
Our first metric quantifies the contribution of converted leads. It shows the overall contribution of converted leads to total revenue. It gives us context for the other lead conversion metric’s we’ll look at. For example, it will help us determine whether a figure is good or bad, based on the context of your business. In the case of a well-established company, this figure may be a lot lower due to repeat revenue from existing customers.
Metric 2: Win Rates of Converted Leads
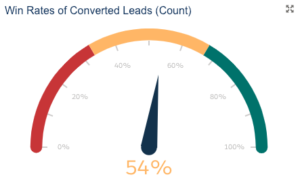
Our second metric compares opportunities that started as a lead, with opportunities that a salesperson linked to an existing customer or prospect. Therefore, the win rate is defining the ratio of lost vs won deals in any given period.
Now, I’ve been a bit cheeky here, because this metric is actually broken down into two:
- Win rate by count (compares the number of lost and won deals)
- Win rate by amount (compares the value of lost and won deals)
Metric 3: Average Deal Size of Converted Leads
Our third metric compares an average deal size originating from converted leads, with opportunities created directly on the account.
With this metric, you can also customise your report to look at the metrics broken down by the sales team, location or any other variable you feel may be appropriate.
Metric 4: Win Rates by Lead Source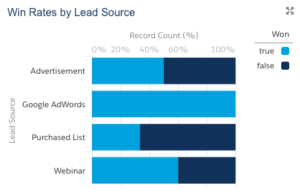
Measuring our fourth metric will determine the effectiveness of converted leads. The lead source records the originating source of the lead. For instance, if you had been at a show, you might record the lead source of prospects encountered for the first time there as ‘Trade show’.
When a lead gets converted, we can analyse opportunity outcome by the lead source, as it will have been carried through to the relevant fields on the opportunity.
Metric 5: Win Rates by Campaign
Our final metric is similar to lead source in the way it’s tracked and recorded but focuses on the prospects campaign. This is personally one of my favourite metrics, as it provides really important insight into the monetary value of each Salesforce campaign. Note: if you’re using Salesforce campaigns in conjunction with Pardot campaigns, make sure you read up on the differences.
Next Steps
Now you know what to measure, I recommend you install a Lead Conversion Dashboard. Remember, it’s important with each of these metrics to interpret them in the context of your business. If you need any help getting up and running, you can get in touch with us. Happy measuring!