Salesforce CRM Analytics is a powerful tool that allows organisations to analyse and visualise their data in a user-friendly and intuitive manner. In today’s data-driven landscape, businesses face the challenge of extracting meaningful information from vast amounts of data. That’s where CRM Analytics comes in.
With CRM Analytics you can explore your data through interactive dashboards, charts, and graphs, uncovering hidden patterns and trends.
Data Visualisation
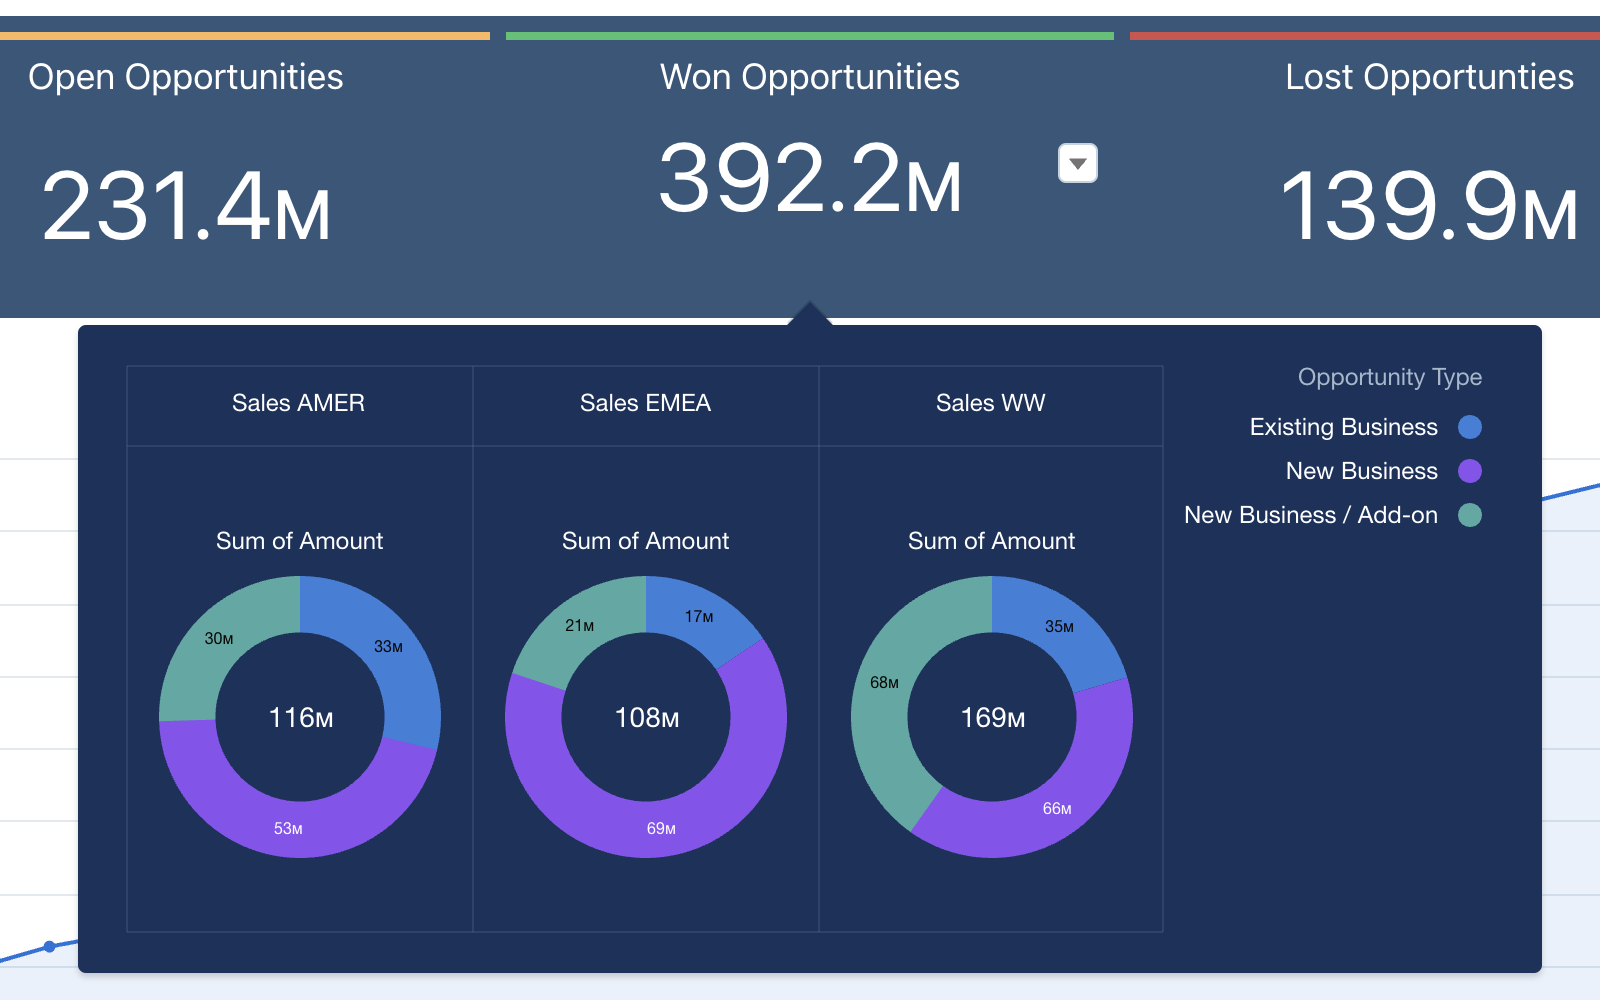
One of the standout features of CRM Analytics is its robust data visualisation capabilities. Instead of sifting through spreadsheets and numbers, you can present your data in visually appealing and interactive formats. Take a look at this screenshot of the Performance Summary component from the Analytics Design Toolkit dashboard you can find in the Design Style Guide app. This analysis provides a high-level overview of your sales and service performance, giving you a clear picture of their achievements and areas that need improvement.
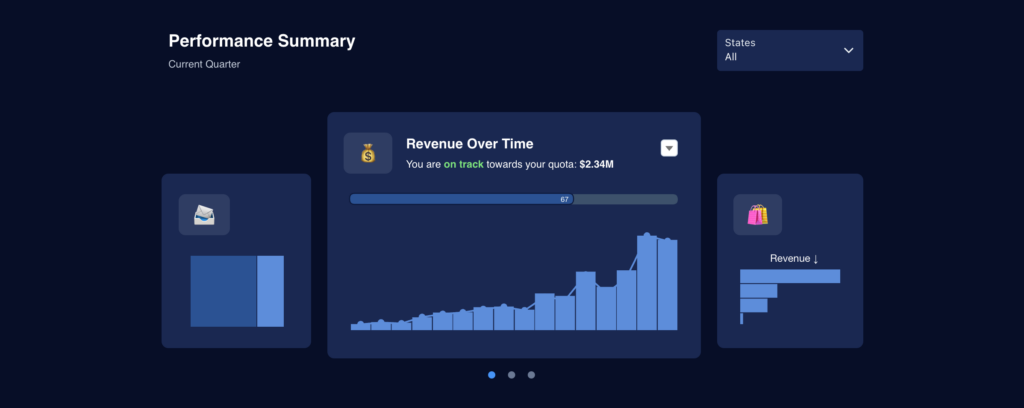
With just a quick glance, you can identify quota attainment status and average CSAT score. Notice how this visualisation presents only a few selected values. A timeframe and geographic information anchor the perspective. This drives the viewer’s attention to the key takeaways.
A lot more information is available upon hover and introduced with appropriate icons or visualisation. You see the revenue and quota target timeline, open-closed case breakdown, and even track the best-selling products. Any of these can lead to further insights, all at our fingertips.
Another visualisation approach is showcased in the Agent Performance chart below. It demonstrates how you can gain insights into your service agents’ performance with case CSAT.
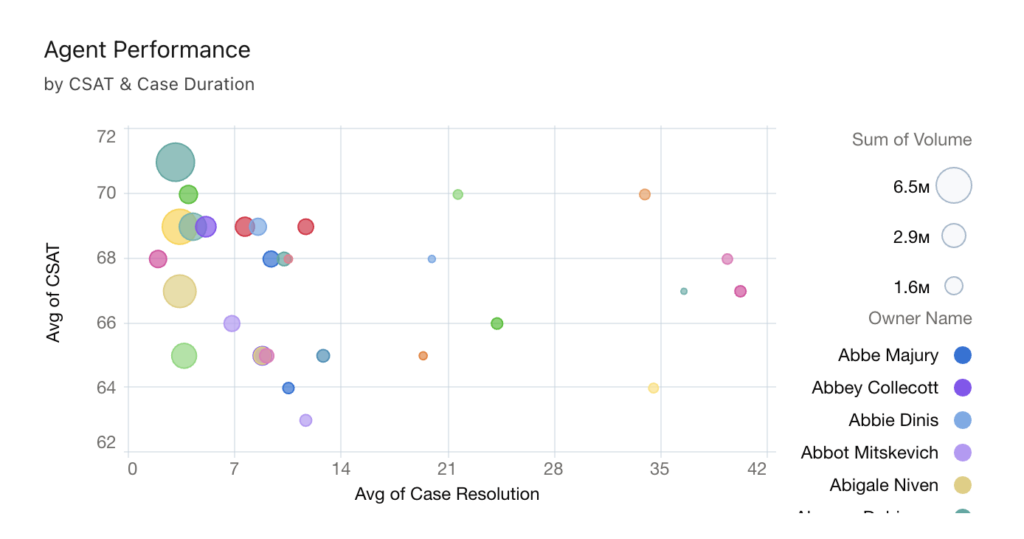
The size of the bubble in the scatter plot chart is the volume indicator. With this type of visualisation, you can prioritise your performance ensuring an optimal customer experience.
Say Goodbye to Spreadsheets
It’s time to say hello to the vibrant visuals and interactive dashboards of CRM Analytics. By leveraging the power of CRM Analytics’ visualisation, organisations can gain a deeper understanding of their data and make well-informed decisions. CRM Analytics is a trusted tool that eliminates guesswork and provides concrete insights for driving positive business outcomes.
In conclusion, CRM Analytics is a reliable and established solution for data analysis and visualisation. Your data holds the key to success. Whether you’re analysing sales performance, exploring customer service, or, for example, evaluating the effectiveness of your marketing campaigns, CRM Analytics equips you with the tools you need to unlock the full potential of your data.
Intrigued by the power of CRM Analytics? Discover how Salesforce CRM Analytics can transform your data analysis and visualisation. Visit our website to explore our comprehensive analytics offerings and unlock the full potential of your data today.