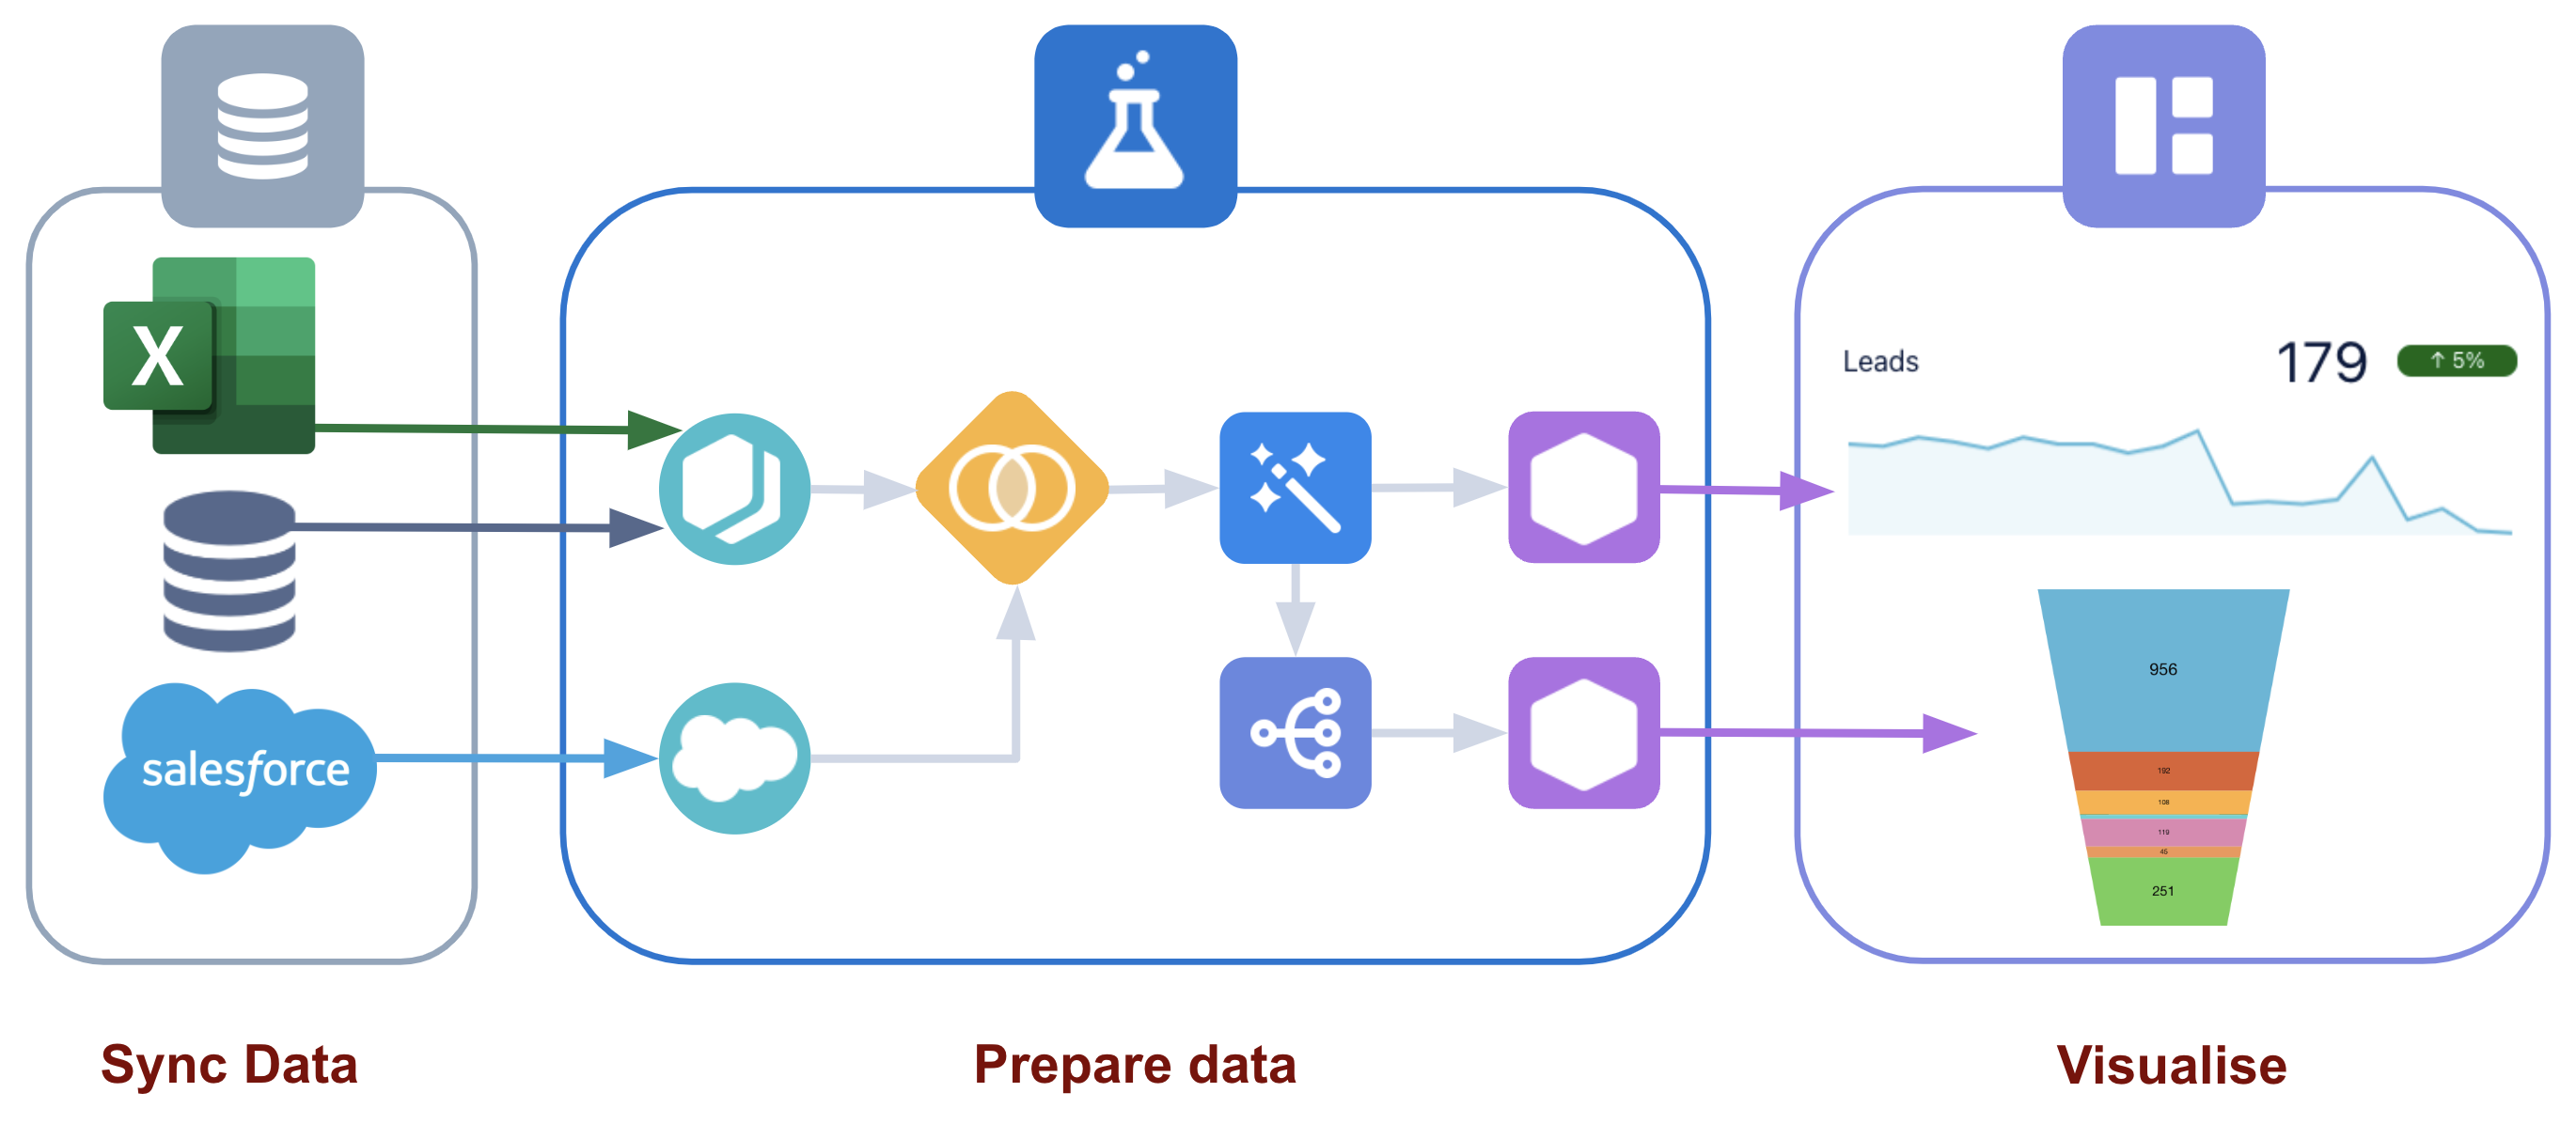
When starting out with CRM Analytics, you have a blank canvas. Unlike with standard operational reports in Salesforce you do not have report types or any data to report on. This means you need to plan and prepare this data yourself in the Data Manager. Although you have to do this work yourself, it gives you great power and much can be accomplished using clicks not code.
Recipies
One of the great advantages of preparing your own data is the ability to go beyond report types. There are many limitations inside Salesforce reports that often require additional custom objects and automation to achieve results. This is where recipes step in. The goal of the recipe builder is to create datasets (think report types) which can then be used in visualisations in Analytics Studio.
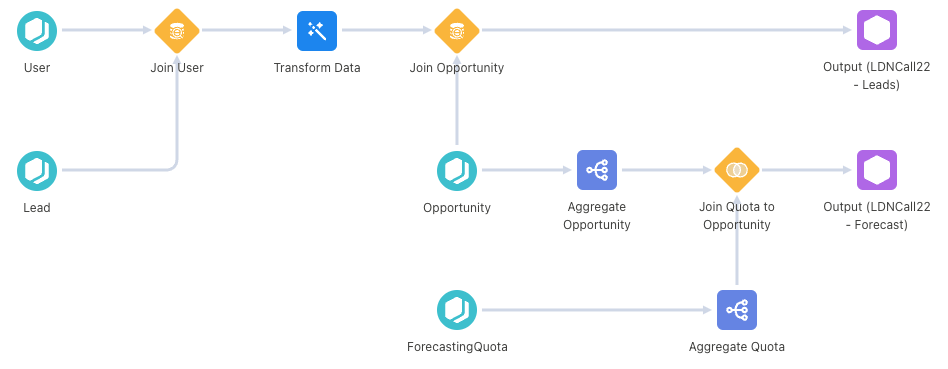
Anybody familiar with Flow will notice a similarity. You add nodes to a page working from left to right bringing data in from multiple sources and outputting them as datasets.
Joining Data Together
The yellow diamond shapes in the recipe canvas are where we join two sets of data together.
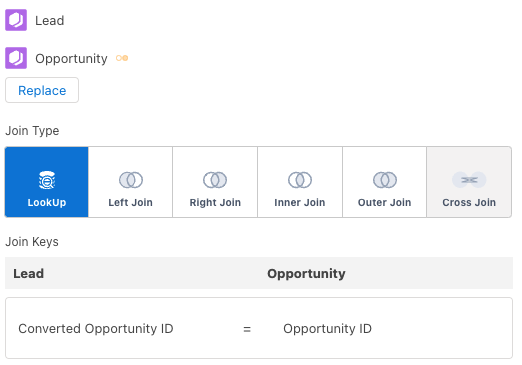
There are multiple join types:
- Lookup – Gets each row in our first dataset (in this case Lead) and finds a single matching record in the second dataset (Opportunity)
- Left Join – Gets each row in our first dataset and finds all matching records in the second dataset
- Right Join – Gets each row in our second dataset and finds all matching records in the first dataset
- Inner Join – Only includes rows if there is a matching record in both datasets
- Outer Join – Include all data from both datasets if they match or not
- Cross Join – Combines unrelated records and includes all rows from both datasets without a join key. Every row from the first dataset is paired with every row on the second dataset
Once you have selected the method of joining your data together you need to decide which fields you will use to match the data.
As we can join together data using our own join keys, this allows us to create relationships between data without relying on lookups in Salesforce. For example, we can create a dataset with all leads and all opportunities matching them on the converted opportunity Id. This allows us to have a single view of our sales pipeline. This is not possible with standard Salesforce reports.
Transforming Data
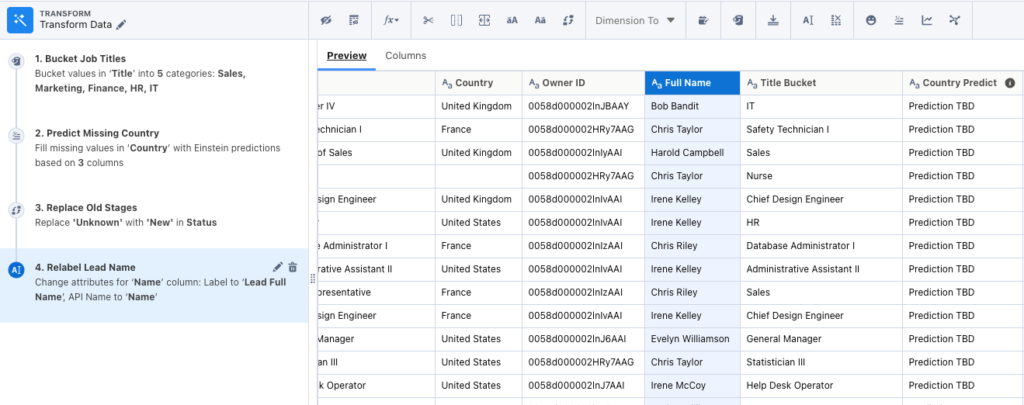
The blue icons with the magic wand allow us to make transformations to our data. There are many ways you can transform your data (too many to list in this post).
My favourites are:
 |
Bucket Values | As with standard Salesforce reports, you are able to group values into buckets. Unlike standard buckets, you can use smart bucketing which allows fuzzy matching to get rid of those pesky typos. |
 |
Predict Missing Values | When data is missing use the power of Einstein to predict what the value should have been based on with fields in your dataset. |
 |
Replace Values | Swap out values in your data without affecting the data in your system. You can also fill in the blanks. |
 |
Edit Attributes | This allows you to change the label and API name of columns in your table. This can be powerful when you have 3 columns called name (e.g. Opportunity Name, Owner Name, Contact Name) so you can easily distinguish between them. |
 |
Detect Sentiment | Using the power of Einstein, look at a column of data and predict if the value is positive, negative or neutral |
 |
Formulas | The formula field is a powerful tool in the Salesforce admins toolbelt. In recipes, this power has been enhanced with more capabilities including grouped data. |
One of the best things about the recipe builder is that you can preview all the changes you make. This saves you a great amount of time because if something does not look right, you can correct it before building with the dataset.
Next Steps
Now that you know how to prepare your data in a way in which it can be used to build powerful dashboards, the next step is to start visualising data with your datasets. But have no fear, you can also build powerful CRM Analytics visualisations without code.
If after reading this, you are ready to start your CRM Analytics journey or take your org to the next level why not get in touch with our certified CRM Analytics experts. We are on hand to support the architecture, train and build powerful visualisations to help bring the power of CRM Analytics to your Salesforce org.