Someone asks you to build a report and gives you all the necessary information. You proceed to create it, review it, and test its results. But when you present your dashboard, the person who requested it does not trust the numbers they see. How can you build that trust and start leading with data?
This situation can happen due to various reasons. It might be because they are comparing the results to reports they are more accustomed to (in Salesforce, Excel, or another tool) or that they have a gut feeling that things don’t look quite right.
Most of the time, it has nothing to do with the report or the data it is showing but rather an additional layer of uncertainty about what drives that data. It is easy to show a pipeline with forecast categories and probability factors. But how accurate are they, and what is impacting these numbers?
What does good look like?
Once you have started thinking about what could impact your data, you may start thinking of questions you must answer. For example, when looking at sales opportunities, these could be:
- What is the size of the deal? – Larger value opportunities are likely to take longer to close. They can get more attention from the business with more parties involved.
- The type of account you are selling to? – Many business factors can impact the sales cycle, from industry to whether they have done business with you.
- What products are involved? – If you sell multiple types of products or services, it is likely that they will have different cycles and audiences, which can impact the speed at which they go through the pipeline and the likelihood of closing.
- Which salesperson is leading? – Each sales team will have stronger members and junior members. With experience, a salesperson can tell when something should enter the pipeline or is lost sooner than a more junior person. Even with the same sales target, the amount that person needs to generate in their pipeline may vary.
- How long is an opportunity open? – Some businesses have longer sales cycles than others. But all businesses have a point where a deal should be closed off. If your pipeline is full of opportunities where the close date is constantly pushed back, it is unlikely these deals will ever close.
- The number of activities logged? – It is safe to assume that the more contact you have with a buyer, the more likely they are to be engaged. If your sales team uses Sales Engagement or a similar tool, you will have good visibility of these activities. You may identify patterns such as 1 demo having a 50/50 success rate, while 2-3 demos increase the likelihood to close by 30%.
You may think somebody in the business must know which questions to ask and the answers to them. However, if you have yet to start your journey to becoming a data-driven business, more work will likely need to be done.
How do I get these answers?
Although Lightning reports and dashboards are fantastic, they have some limitations. At this point, we will turn our focus to CRM Analytics. Why CRM Analytics? We can combine data that is impossible to combine with standard report types, quickly ask questions about that data, visualise it in multiple ways and pivot our focus easily.
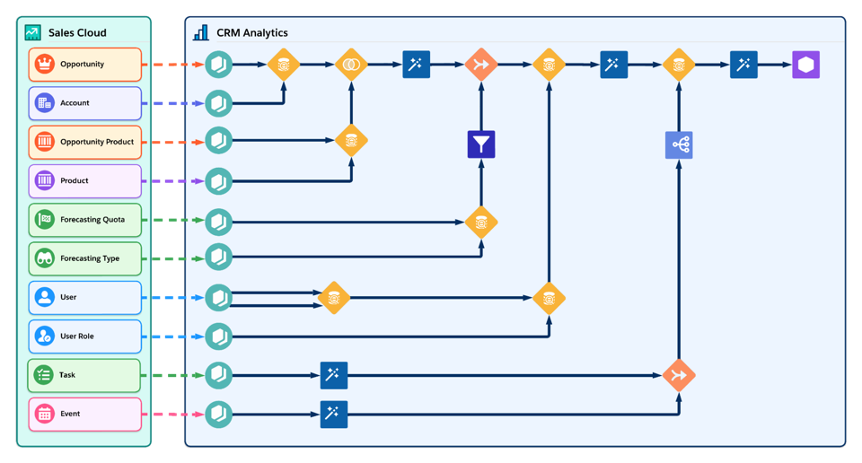
We want to build a ‘mega dataset’ to get us started. This should include information related to our core object (in this instance, opportunity). This could consist of tasks, events, products and forecasts. By combining all of this information using a recipe, you will end up with a dataset allowing us to explore and ask many questions to determine what is important.
Looking Through the Lens
In CRM Analytics, a Lens is the equivalent of a report in Salesforce. They allow us to build visualisations of our data quickly. If you need help deciding which questions to ask, the platform is here to help us with the natural language search box at the top of the page. It Gives suggestions that, once selected, will automatically create the report for you.
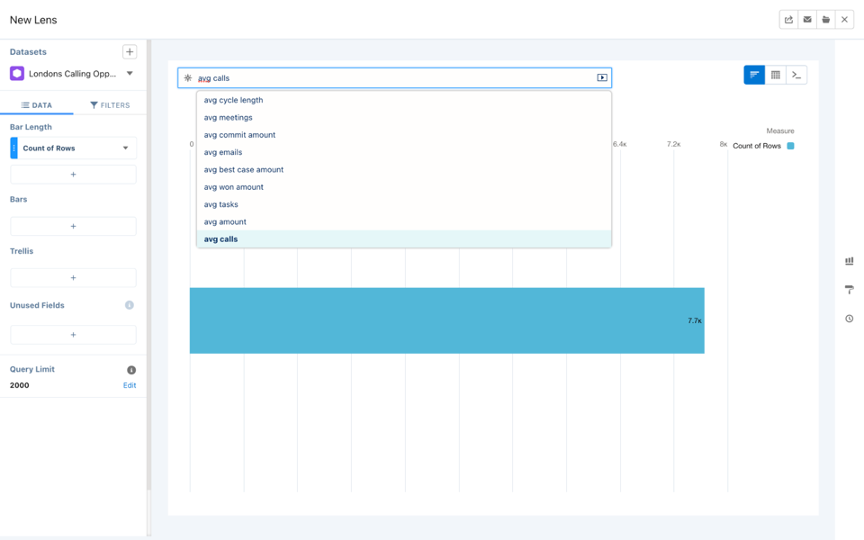
By exploring our data in this way, we can look at what impacts our data but, importantly, what does not. What influences your data will change over time without you realising it. This can leave some business users making assumptions about the data that are no longer true. We have seen how changes in the market can change buying behaviour, which results in the forecast that may have been accurate 6 months ago no longer valid.
Although the Lens allows us to ask all these questions, we don’t want to repeat this exercise whenever we explore our data. This is when we take our reporting to the next level.
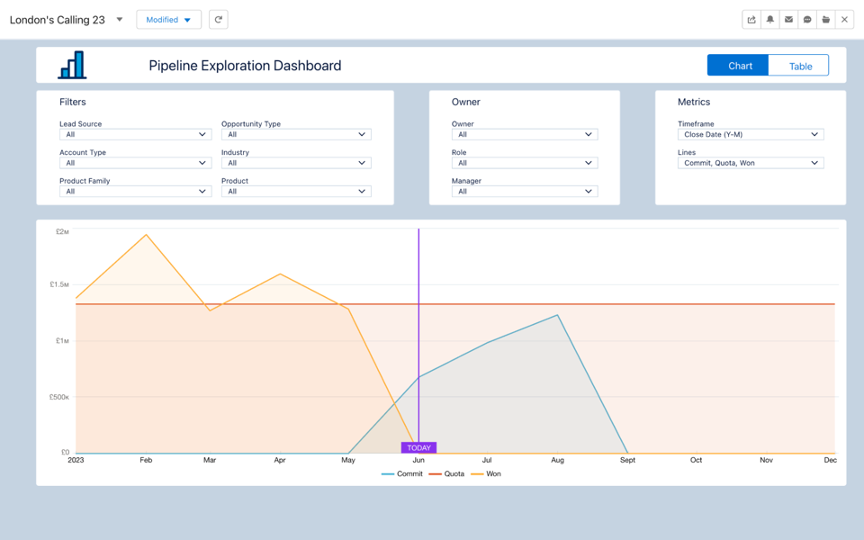
Introducing the exploration dashboard
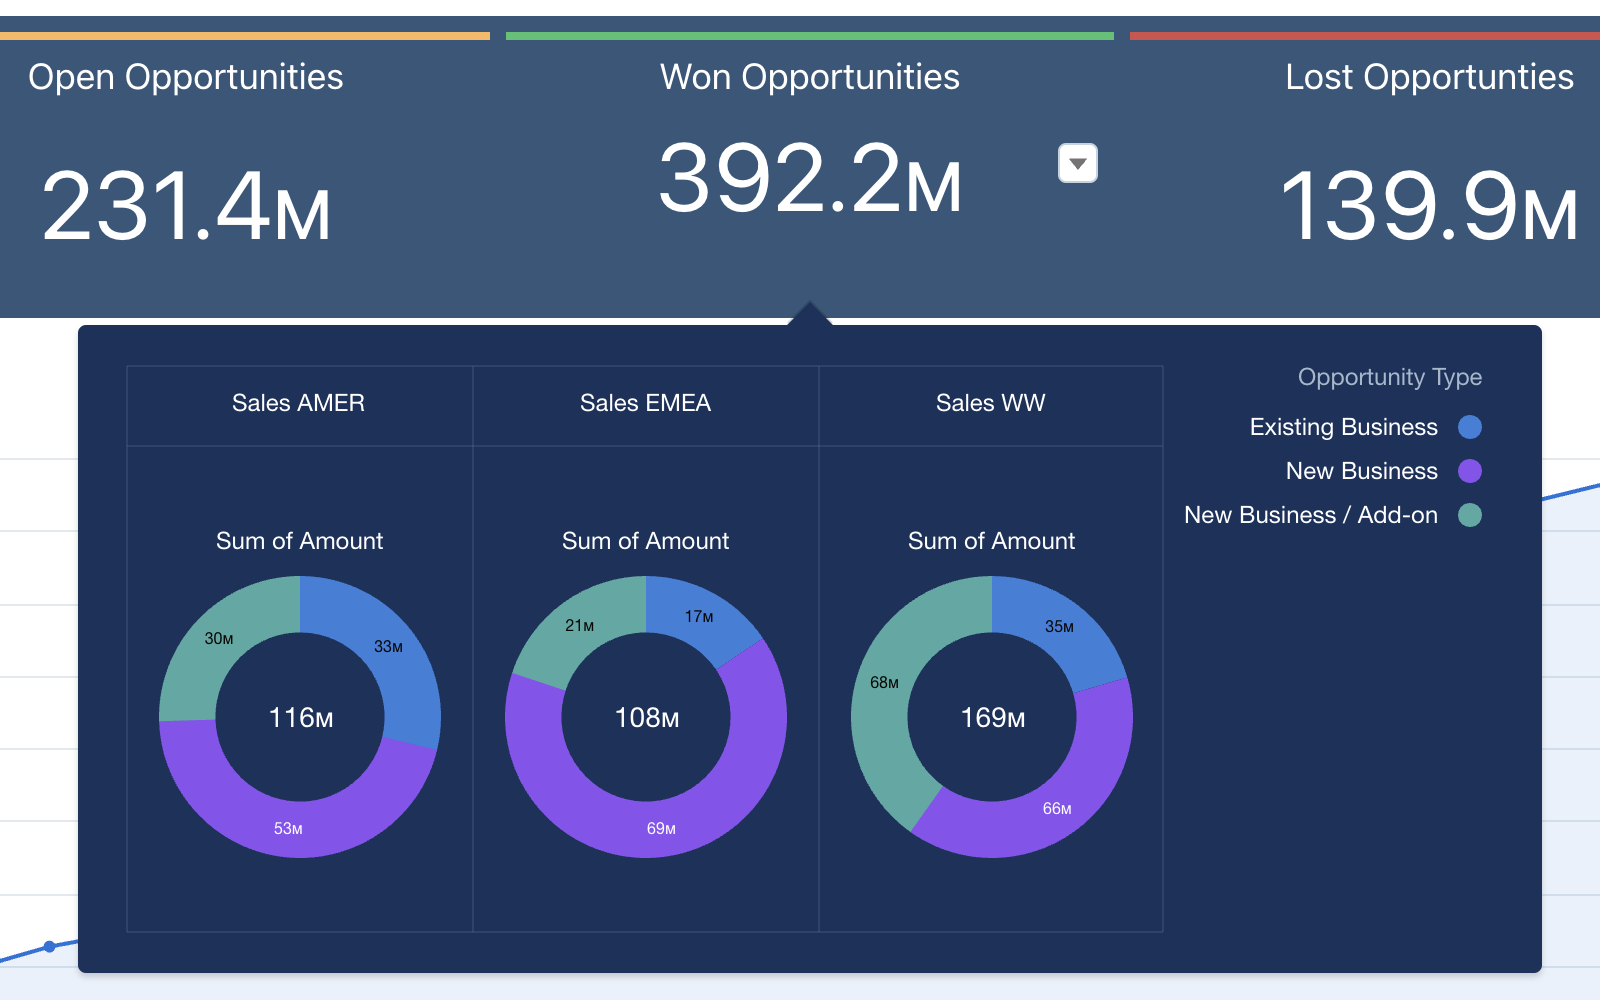
How can we create a structured and regular process for exploring our data? Using the power of a CRM Analytics dashboard, we can build an exploration dashboard containing many filters and a simple chart and table view of the data. These filters should be based on the information gathered from your Lens exploration. Changes to these filters should impact the visualisations. This allows you to ask lots of questions about your data quickly and to find out what matters.
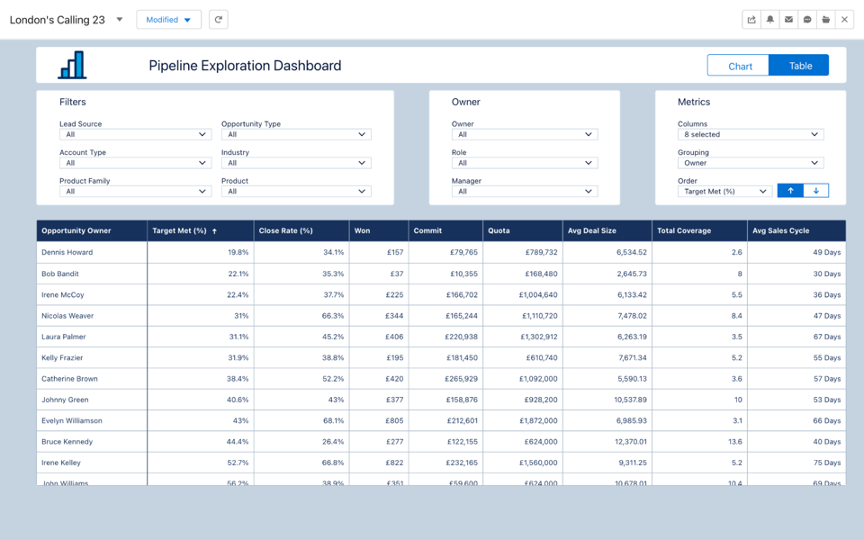
In addition to graphs, you can create a table view, with the ability to toggle between the two views comparing how the data look. This view can help users who prefer doing analysis in Excel to feel more at home. They can group, sort and filter the dashboard to get the questions they want to answer quickly while using volumes of data that would easily crash Excel in seconds.
You might think this is great but different from what your teams want. You are right to feel this way. The exploration dashboard is a tool to help you build better dashboards. It allows you to find the important metrics and create a dashboard that teams can use to guide them on what to focus on. Best of all, there is evidence to back up the data you are displaying, so leaders can feel comfortable that they are focusing on the right things.
Leading with Data
But do businesses really work this way? It is easy to think this is a lot of work to build a dashboard. However, data-driven companies such as Salesforce use dashboards like these to help them make decisions. These decisions could be on many things, including changing how they manage their pipeline, identifying gaps in the pipeline and marketing to the right audience to fill those gaps or training for individuals.
To be a data-driven business, you can’t just collect lots of data, clean it, analyse it or produce actionable analytics; you must use it. This is not a one-time exercise either. You should regularly review your data, add new metrics to your dataset, validate your current processes and update business dashboards. Your business does not stop evolving, and neither should your reporting.
What Next?
I was pleased to speak on this topic at London’s Calling in June 2023. So keep an eye out on their YouTube channel for when the recording is available.
If you are still trying to figure out how to start leading your business with data, contact one of our analytics experts, who can help guide you through this journey.