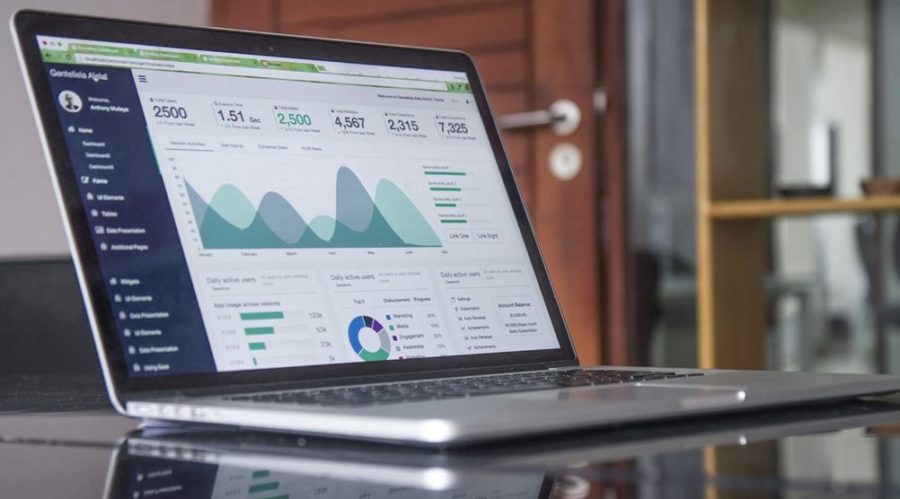
Einstein Analytics is a product that is evolving rapidly and becoming more popular, mainly due to licences being included with other Salesforce projects such as Pardot.
But, while many Pardot customers have access to B2B Marketing Analytics, a lot of them are not sure what to do with it. B2B Marketing Analytics comes with many out of the box dashboards; however, for most Pardot customers, they are not a perfect fit and either need a few tweaks or a complete overhaul.
But where do you start?
First off, it is best to start with the basics and understand the terminology Einstein Analytics uses. This is an initial roadblock because it is not the same as what is used in Pardot or Salesforce.
Einstein Analytics is made up of four core components:
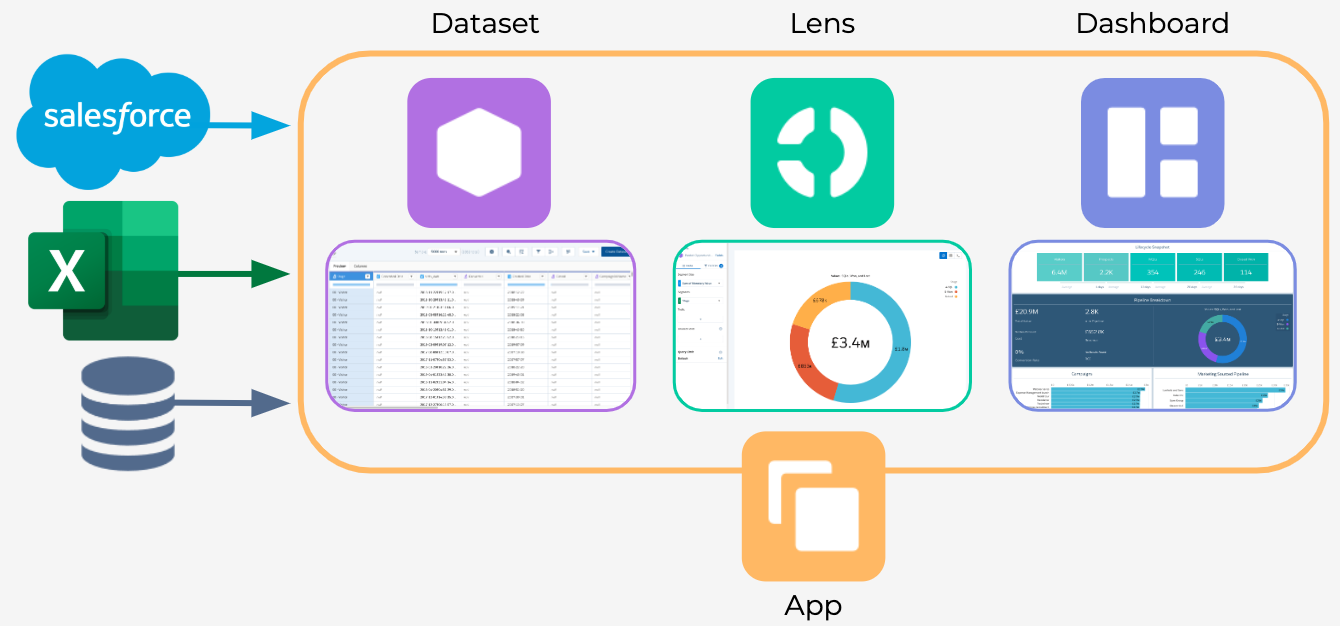
- Apps – Think of these as folders to store all of your assets. Similar to folders on your desktop, you can provide a name and decide who can have access to its content.
- Datasets – Think of these as Report Types in Salesforce. They contain all the fields and data that can be used. And just like Salesforce, you can create your own custom datasets.
- Lens/Query – Think of these as Reports. The lens explorer in Einstein Analytics has some similarities to the Lightning report build; you can choose your fields, groupings and filters.
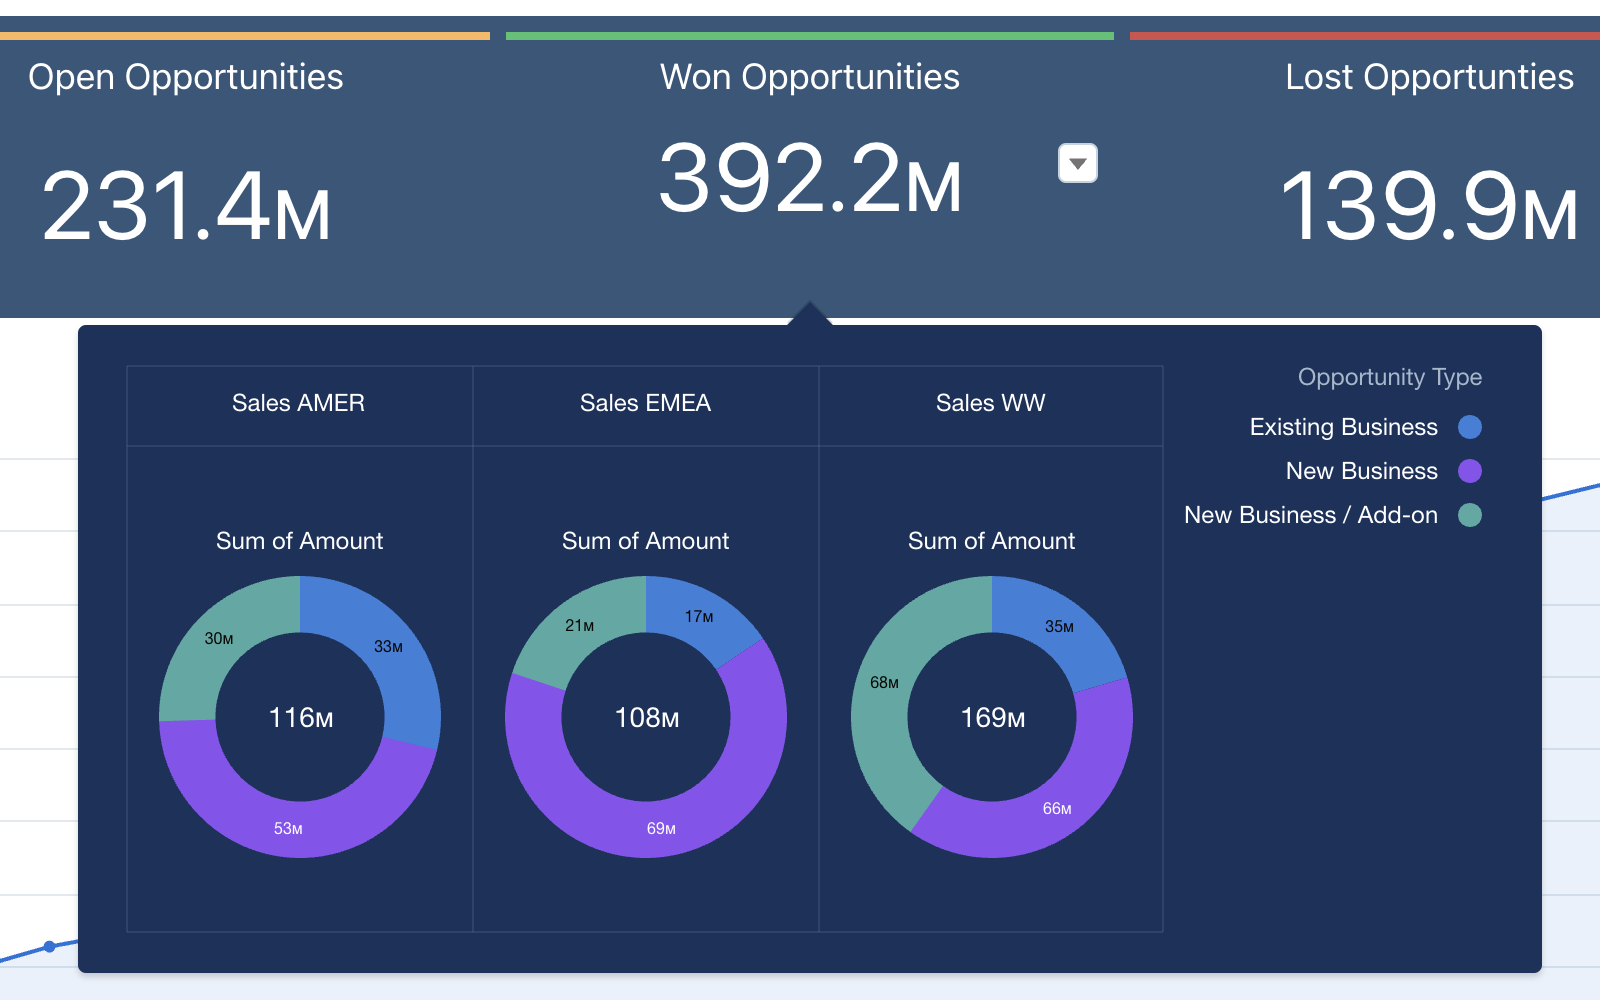
- Dashboards – The most familiar of the names, dashboard are groups of Queries that display the date in the format you want. Just like Salesforce dashboards, you can have multiple components and format your data in a variety of ways.
Where does my data come from?
Einstein Analytics is a separate platform to Salesforce and Pardot. As such, it is initially an empty database. You can bring data in from Salesforce, upload CSV files and upgrade to Einstein Analytics Plus. If you do this, you can bring data in from other systems using the pre-built connectors. These include Google Analytics, Microsoft Azure and Amazon AWS.
When using B2B Marketing Analytics, Salesforce builds a connection for you between Pardot & Einstein Analytics. This includes an App, Datasets & Dashboards ready for you to use.
Building Dashboards
Once you have got the data you require, the next step is to start building your own custom dashboards. But before you jump in, there are some steps you should follow first.
Plan
Planning is an important step that many try to skip, although it is one of the most important (and will save you a lot of time in the long run). The core four things you should think about are:
- Workshop: Bring multiple stakeholders together, get input and set a purpose. It is crucial to have a mixed audience, as people will have different opinions and priorities.
- Purpose: Who are you building your dashboards for? What is the goal for the
 dashboards? And why would your users use them?
 - Prioritise: Once you have all of your ideas, start to prioritise and work on a plan to build the most important items first, then start working your way down (you can always come back to these later).
- Sketch: Start getting an idea of how things can look. If you can get everybody in the workshop to sketch and compare, this is important as since you have so much flexibility you can waste a lot of time changing your mind as you build.
Design
Once you know what to build, you should start to design. To get you started, Einstein Analytics provides a lot of out of the box template dashboards. These have been designed from experience and studies done by Salesforce to understand how people view dashboards, so it is always a great place to start.
Four key things you should be thinking about are:
 Clarity: Eliminate ambiguity. Ensure that anybody viewing the dashboard understands what they are looking at and there is no confusion.
- Efficiency: Think about the journey a user will make on the dashboard, help people find what they are looking for faster.
- Consistency: It is unlikely you will only have a single dashboard. So when designing, keep pages and layouts consistent, so users don’t have to re-learn where certain types of metrics are.
- Beauty: Einstein Analytics provides you with tools to make your dashboards look nice. Don’t focus too much on your companies brand colours, focus on highlighting the right areas and making things clear and easy to read.
Build
Finally, you are at the build stage. Now you know what you are trying to achieve and how things are going to look, you can focus on making a dashboard that serves the user’s purpose in an efficient way.
Four things to think about before you start building are:
 Prioritise: Make sure your KPIs are the star of the show as these are the most important things. A good dashboard invites the user to drill down to find more information.
- Group: Group filters and similar metrics. By keeping related items in the same place, you stop users having to jump around the dashboard trying to compare metrics.
- Efficient: Ensure that your dashboard is designed for speed, eliminate unused queries and take advantage of the dashboard inspector.
- Space: Don’t try and get everything onto a single page. Leave spaces between components, split related information into pages and allow components to be explored.
What next?
If you need any help getting started or want to dive deeper into the world of Einstein Analytics, get in touch with our experts and see how we can help