In the competitive world of sales where efficiency and accuracy are the keys to success, Pipeline Inspector is here to help. Pipeline Inspector boosts sales efficiency with consolidated pipeline data, metrics, AI insights, and close date predictions, enhancing accuracy and success.
In this blog post, we’ll run through how to set up Pipeline Inspector. We’ll highlight the key benefits of Salesforce Pipeline Inspector, demonstrating its potential as a game-changer for your sales team.
So, Who is it For and What Are The Key Benefits?
Salesforce designed Pipeline Inspector for salespeople and their managers, to better understand the quality of their pipeline. This means you can keep things out of separate spreadsheets and manage them all in one place.
Some of the key benefits are….
- Enhanced visibility
- Ability to create custom filters and list views
- Accurate forecasting
- View recent activities without opening records
- Quickly see how deals have changed over time (e.g. with colours or arrows)
Activating Pipeline Inspection
If you navigate to Pipeline Inspection Setup, it will guide you through the process of activating Pipeline Inspector in your organization. This includes adding the button to the opportunities list view page, assigning the relevant permission set, and setting up Historical Trending.
Opportunity Historical Trending allows you to track a total of 8 fields. You can choose three of your preference, and the system sets the remaining five to Amount, Close Date, Forecast Category, Probability, and Stage by default.


Defining How Metrics Are Summarised and Grouped
You have the ability to select the summary fields users can apply to view their metrics. Choose from Amount, Quantity, Expected Revenue, or any custom currency or number field. You can also apply groupings to visualize pipeline changes with a chart, allowing you to see and understand those changes for specific time periods.
Alternatively, you can group by forecast category where you can tie your pipeline metrics to a single forecast category or to multiple related categories. When enabled, the Flow Chart shows changes in forecast categories.

Selecting a Forecasting Rollup Type
There are two rollup types which you can use.
- Single Forecast Category Rollups will show one forecast category per metric. For example, if users need to see totals for the month or quarter they would add the Best Case, Commit and Closed forecasts together manually.
- Cumulative Forecast Category Rollups will show multiple categories per metric. In this example, users see the cumulative amounts from opportunities in the named forecast category.
Einstein Deal Insights
The availability of different deal insights depends on which Einstein features have been enabled. You can manage via the Pipeline Inspection Setup.
- Opportunity Closing Likelihood provides details on the likelihood of an opportunity closing when Einstein Opportunity Scoring is enabled.
- Call Recording shows challenges and risks from voice and video calls when Einstein Conversation Insights is enabled.
- Emails display insights from emails, such as budget concerns or competitor mentions, if both Einstein Activity Capture and Email Insights are enabled.
- Close Date Predictions show predictions for opportunities with close dates in the current month that are unlikely to be won within the same month.
- Service Cases offer insights about service cases that may affect the progress of an opportunity.
Einstein Opportunity Scoring
Einstein Opportunity Scoring helps prioritise opportunities so your sales team has the best chance of closing the most deals. After setting up Opportunity Scoring, Pipeline Inspection automatically incorporates insights. Pipeline Inspection displays these insights in tiers instead of numeric scores and highlights changes when the score moves up or down a tier.
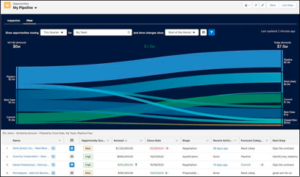
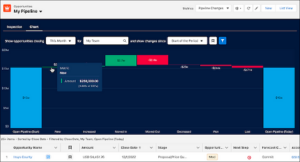
Pipeline Inspection Flow Chart
The Flow Chart enables users to see changes to their pipelines in an interactive chart. Users can see changes in amounts from one forecast category to another, and filter results to see the data that’s most useful to them.
Summary
Pipeline Inspector empowers sales teams, optimizing pipelines, enhancing performance, and enabling data-driven decisions with versatility. By leveraging its capabilities, you can identify and address issues, streamline processes, and ultimately boost your sales efficiency. Whether you’re a sales manager looking to enhance team performance or a sales rep aiming to close deals more effectively, Salesforce Pipeline Inspector is a valuable resource that can drive success in the competitive world of sales. Get in touch with us today if you’d like to find out more.